
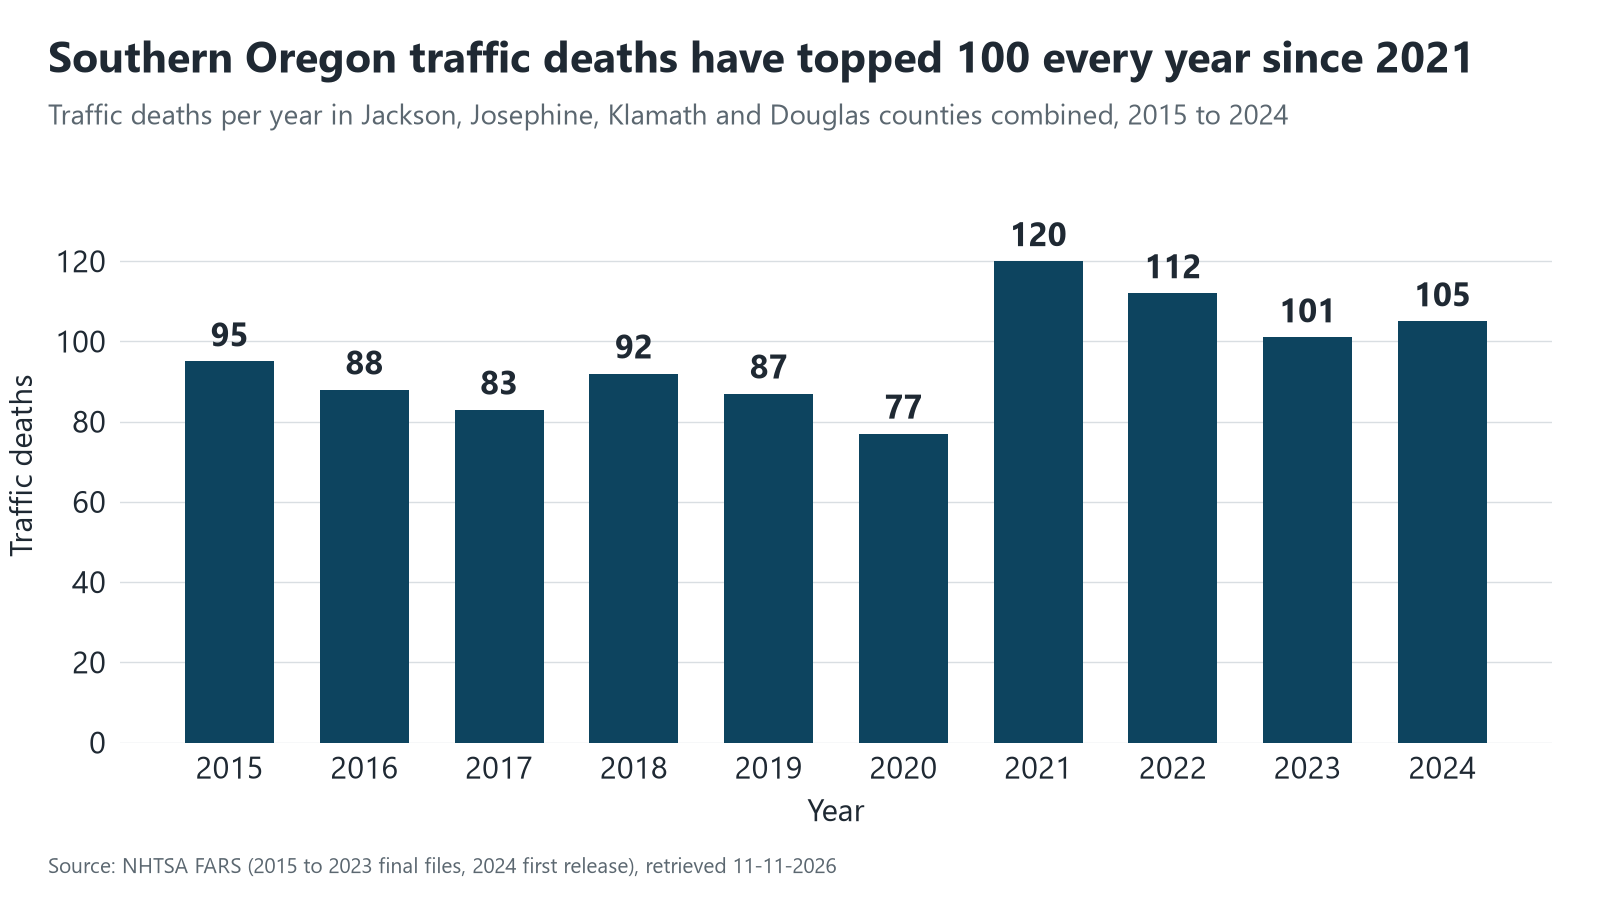
Short answer: Traffic deaths in Southern Oregon are higher than they were before 2020. Jackson, Josephine, Klamath and Douglas counties together had 83 to 95 deaths a year from 2015 to 2019, then more than 100 every year from 2021 to 2024. The number of reported crashes has not grown, so the change is in how many crashes turn deadly.
Are crashes going up or down?
It depends on what you count. We used two official sources. The federal Fatality Analysis Reporting System (FARS), run by the National Highway Traffic Safety Administration (NHTSA), counts only crashes where someone died. The Oregon Department of Transportation (ODOT) counts every crash reported to the state.
Start with deaths. From 2015 to 2019, the four counties lost between 83 and 95 people a year on the road. In 2020 the count fell to 77. Then it jumped to 120 in 2021, the highest of the ten years. It has eased since then, to 112, 101 and 105, but it has not gone back to where it was. Oregon as a whole followed the same path: 493 deaths in 2019, a peak of 602 in 2022, and 538 in 2024.
Now look at all crashes. ODOT recorded 6,260 reported crashes in the four counties in 2019 and 5,985 in 2024. The number of people hurt was about the same in both years (4,673 and 4,609). So the roads are not seeing more crashes than before. More of the crashes that do happen are fatal.
Which counties are hit hardest?
Jackson County, home to Medford, Central Point and Ashland, has the most people and the most crashes. But when you compare deaths to population, the picture flips.
| Area | Traffic deaths, 2020 to 2024 (FARS) | Deaths per 100,000 residents per year | Reported crashes, 2024 (ODOT) | People injured, 2024 (ODOT) |
|---|---|---|---|---|
| Jackson County | 140 | 12.6 | 2,587 | 1,966 |
| Josephine County | 87 | 19.7 | 1,109 | 881 |
| Klamath County | 121 | 34.5 | 1,073 | 786 |
| Douglas County | 167 | 29.8 | 1,216 | 976 |
| Four counties together | 515 | 20.9 | 5,985 | 4,609 |
| Oregon statewide | 2,833 | 13.3 | 48,414 | 39,503 |
Klamath and Douglas counties each had more than twice Oregon’s death rate. Jackson County’s rate was a little below the state’s. One caution: these rates divide deaths on a county’s roads by the number of people who live there. Interstate 5 and U.S. 97 carry many drivers who are only passing through, and their crashes count too.
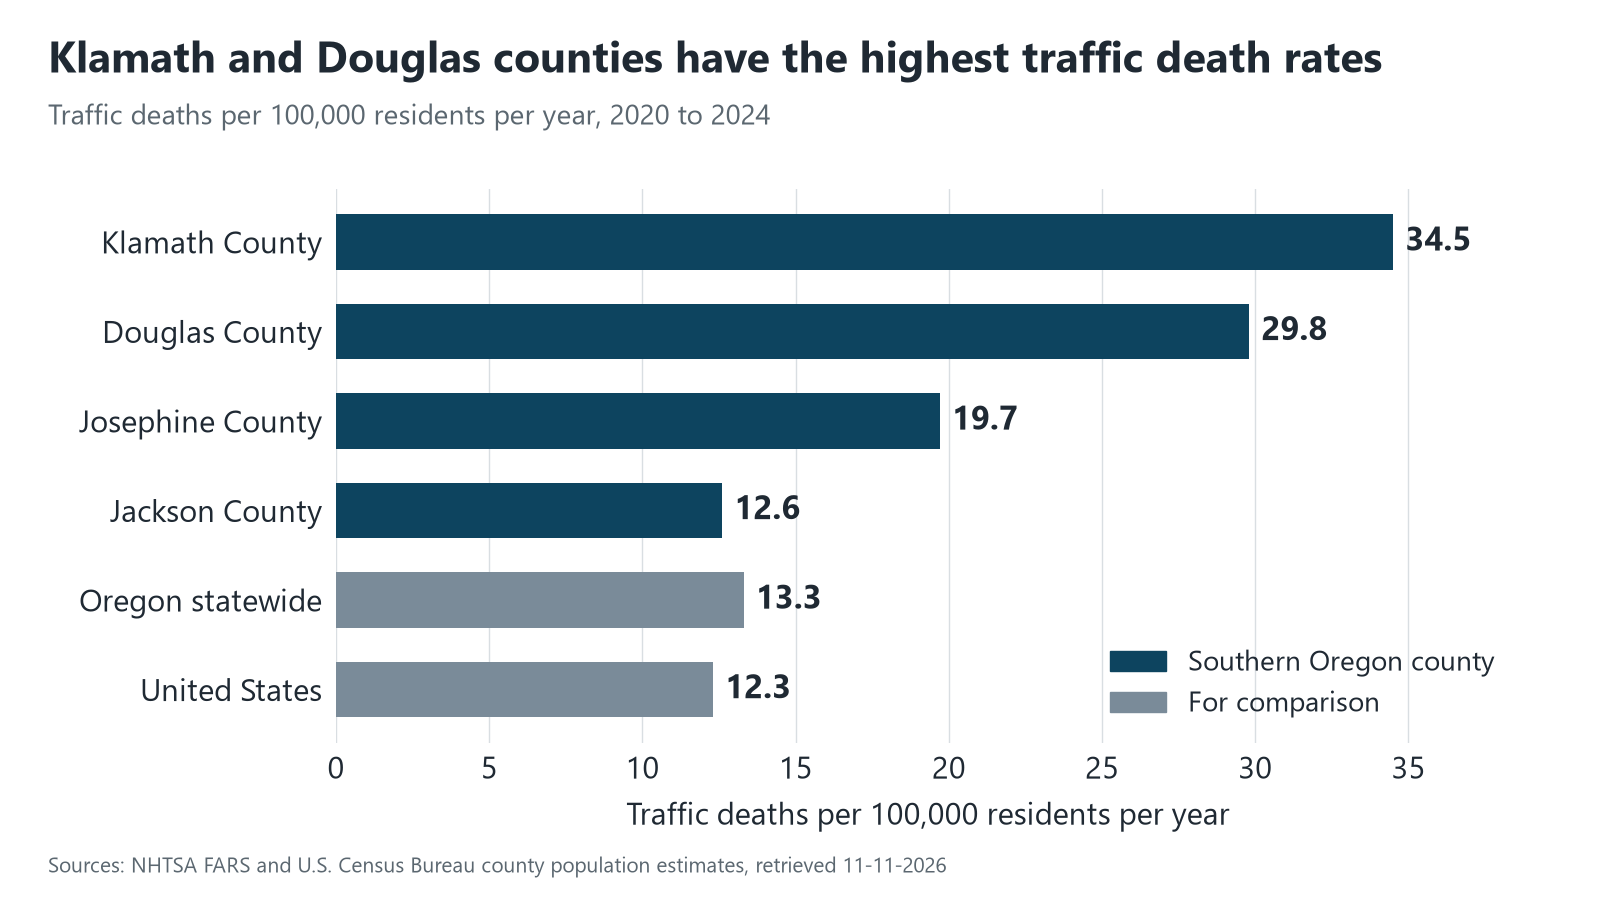
County numbers are small, so they bounce around. Jackson County went from 15 deaths in 2020 to 38 in 2021. One year like that is not a trend. Douglas County is the only one of the four where the count rose every year, from 31 in 2020 to 37 in 2024.
What is behind the deaths?
FARS records details about each fatal crash. Added up over 2020 to 2024, four things stand out in Southern Oregon. These groups overlap. One crash can involve a rural road, alcohol and speed all at once.
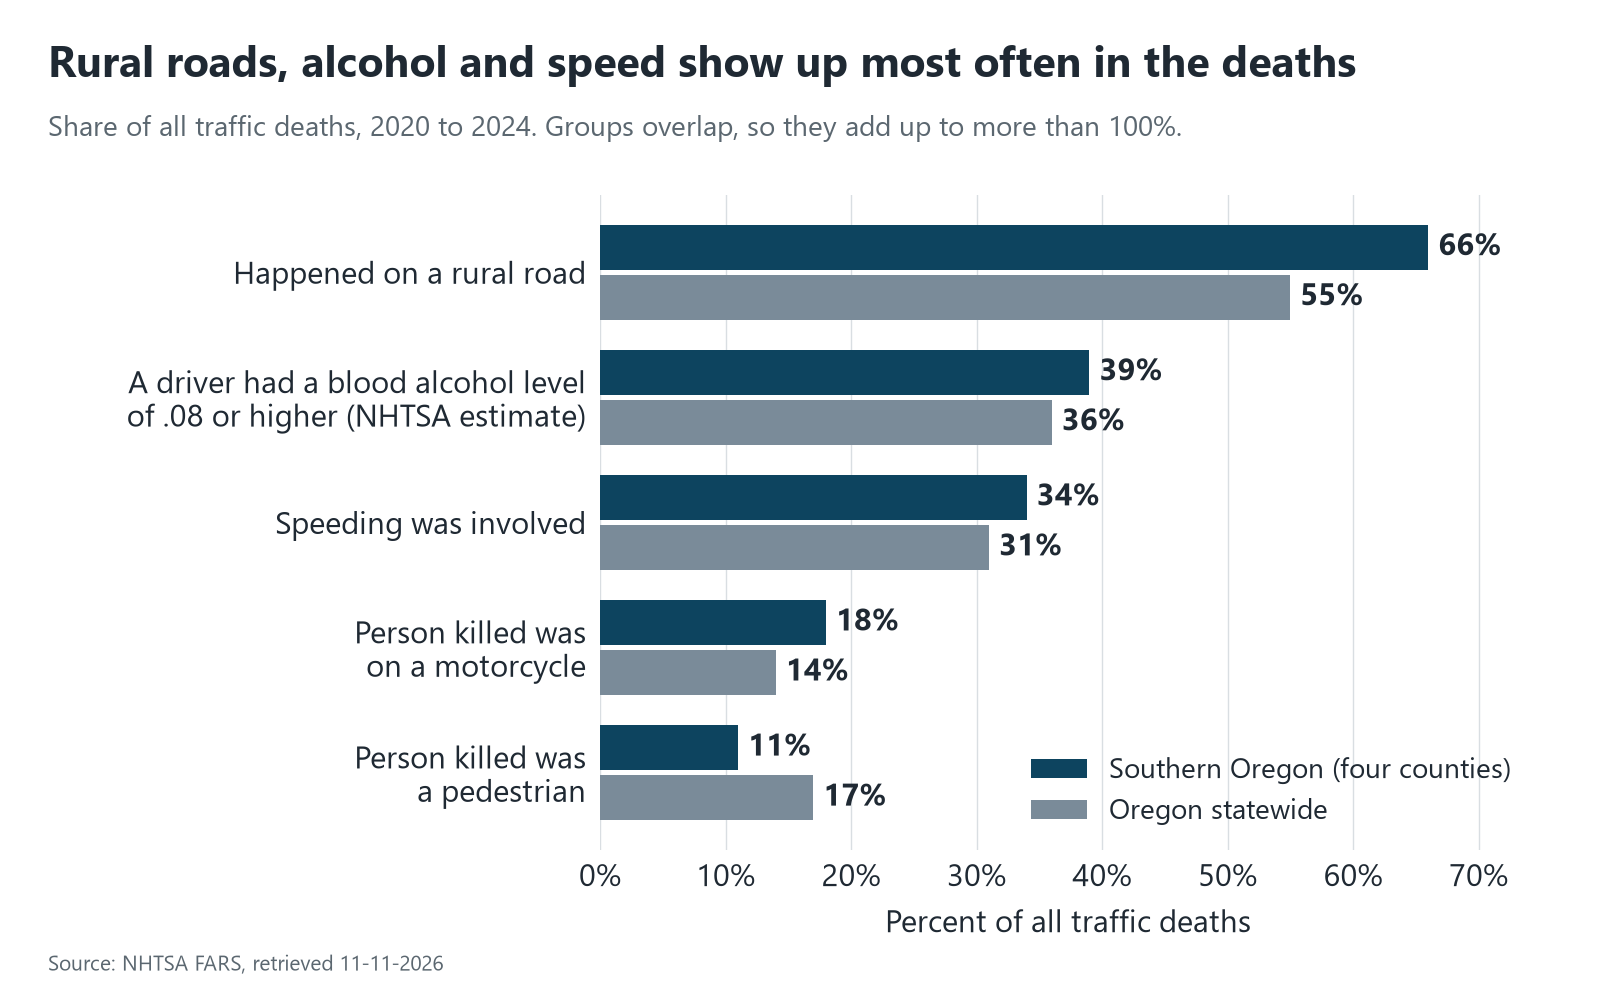
- Rural roads. About two out of three deaths (340 of 515) happened on rural roads. Statewide it was 55%.
- Alcohol. NHTSA estimates that 199 deaths, or 39%, came in crashes where a driver had a blood alcohol level of .08 or higher. That number fell from 55 in 2021 to 30 in 2024.
- Speed. Speeding was involved in crashes that killed 175 people, or 34%. The 2024 count of 45 was the highest of the ten years, but one high year is not a trend yet.
- Motorcycles. Riders were 91 of the 515 people killed. That is 18%, compared with 14% statewide. From 2015 to 2019 the four counties lost 9 to 12 riders a year. From 2020 to 2024 it was 17 to 20 every year.
Pedestrians made up a smaller share of deaths here (11%) than statewide (17%). Of the 55 pedestrians killed, 21 were in Jackson County.
Time of year matters too. July (57 deaths) and August (56) were the worst months over the five years. February (30) and March (29) were the lowest. Fridays and Saturdays had more deaths than any other days of the week.
What this means for drivers
- Most deaths here happen on rural roads. Give yourself extra room and extra time outside city limits.
- Deaths peak in July and August, and on Fridays and Saturdays. Build in extra time for summer weekend trips.
- Alcohol and speed each show up in more than one out of three deaths. Plan a sober ride and ease off the gas.
- Motorcycle deaths are well above where they were before 2020. Riders, wear your gear and stay visible. Drivers, look twice before you turn or change lanes.
How we got these numbers
Deaths and crash details come from NHTSA’s FARS files for 2015 to 2024, which cover fatal crashes only (the 2024 file is a first release and may be revised), and rates use U.S. Census Bureau county population estimates. Total crash and injury counts come from ODOT’s county crash summary dated 04-07-2026, which only includes crashes reported to the state; where the two sources differ by one or two deaths we use the NHTSA count. Alcohol figures are NHTSA estimates because not every driver is tested, small county numbers can swing a lot from year to year, and all data was retrieved on 11-11-2026.
Talk with Idiart Law Group
Idiart Law Group is headquartered in Central Point, Oregon, and has been serving clients since 2001. If you or someone in your family was hurt in a crash, call (855) 772-6969 for a free consultation. Spanish speaking attorneys are available.
Sources
- NHTSA, Fatality Analysis Reporting System (FARS)
- NHTSA, FARS national data files, 2015 to 2024
- NHTSA, FARS Encyclopedia
- NHTSA, State Traffic Safety Information (state and county fact sheets)
- Oregon Department of Transportation, Crash Statistics and Reports
- ODOT Crash Analysis and Reporting Unit, Crash Summaries by Year by County, 2015 to 2024
- ODOT, Crash Data Disclaimers
- U.S. Census Bureau, County Population Totals, 2020 to 2025
This article is general information, not legal advice. Data comes from the public sources listed above and may be revised by those agencies.


